Waveform Generation Tutorial
This section describes theory of operation information for several waveform types and instrument operating modes. The last two topics include information that may help you improve signal quality.
Arbitrary Waveforms
Arbitrary waveforms can meet needs not met by the instrument’s standard waveforms. For example, you might need a unique stimulus, or you might want to simulate signal imperfections such as overshoot, ringing, glitching, or noise. Arbitrary waveforms can be very complex, making them suitable for simulating signals in modern communications systems.
You can create arbitrary waveforms from a minimum of 8 points (33500 Series) or 32 points (33600 Series) up to 1,000,000 points. The instrument stores these numeric data points, known as "samples," in memory and then converts them into voltages as the waveform is generated. The frequency at which points are read is the "sample rate," and the waveform frequency equals the sample rate divided by the number of points in the waveform. For example, suppose a waveform has 40 points and the sample rate is 10 MHz. The frequency would be (10 MHz)/40 = 250 kHz and its period would be 4 µs.
Dual Arbitrary Waveforms
Arbitrary waveforms may be single-channel waveforms, or (with option IQP), they may be dual-channel arbitrary waveforms, such as IQ baseband signals. A dual arbitrary waveform is analogous to a stereo music file. It has two channels of information that contain the same number of samples, always start and end together, and always play at the same sample rate.
You can control the skew and balance between channels on dual arbitrary waveforms either via commands in the SCPI FUNCtion subsystem or via the front panel.
Waveform Filters
The instrument includes two filters to smooth transitions between points as arbitrary waveforms are generated.
- Normal filter: a wide, flat frequency response, but its step response exhibits overshoot and ringing
- Step filter: a nearly ideal step response, but with more roll-off in its frequency response than the Normal filter
- Off: output changes abruptly between points, with a transition time of approximately 10 ns.
Each filter’s cutoff frequency is a fixed fraction of the waveform’s sample rate. The Normal filter’s response is -3 dB at 27% of the sample rate and the Step filter’s response is -3 dB at 13% of the sample rate. For example, for an arbitrary waveform at 100 MSa/s, the Normal filter’s -3 dB frequency bandwidth is 27 MHz.
Turning the filter off may change the sample rate to a lower rate if the sample rate was greater than 250 MSa/s before the filter was turned off.
Waveform Sequencing Applications
Arbitrary waveform sequences are useful when the waveform you want to generate in two situations:
- The waveform is very long and contains repetitions of shorter fragments. These fragments can be repeated any number of times in any order.
- You need real-time control (triggers) to change from one waveform fragment to another.
For an example of the first case, consider a signal that must play the same introductory waveform several times, then play three other waveforms once each, and then return to play the first waveform continuously. This might be a simulated modem data packet consisting of an "idle" signal, a header, some data, a checksum, and a return to the "idle" signal.
This might consist of the following sequence description:
- Play "idle.arb" 10 times
- Play "header.arb" once
- Play "data.arb" once
- Play "checksum.arb" once
- Play "idle.arb," repeating indefinitely.
In the second case, you may want to initiate the sending of "header.arb" using an external hardware trigger. This case might use the following description:
- Play "idle.arb" repeatedly until a trigger is received
- Play "header.arb" once
- Play "data.arb" once
- Play "checksum.arb" once
- Play "idle.arb," repeating indefinitely.
A sequence file (*.seq) contains the information in the numbered lists, and the arbitrary waveform files (*.arb) contain the individual waveforms themselves.
Waveform Sequencing Implementation
The instrument can assemble long, complex sequences of arbitrary waveforms (segments). Switching between segments occurs seamlessly in real time. As an analogy, think of segments as songs in a music player and sequences as play lists.
Each sequence step specifies a segment and how many times it is played. It also specifies whether the sequence waits for a trigger before the next step and how the Sync signal is generated on a step-by-step basis.
For each segment, you can either:
- play the segment from 1 to 1,000,000 times and then advance to the next step
- play the segment once and then stop and wait for a trigger before advancing
- repeat the segment until a trigger occurs and then advance
- repeat the segment until explicitly stopped
Options for Sync signal generation include:
- assert Sync at the beginning of the segment
- negate Sync at the beginning of the segment
- maintain the current Sync state throughout the segment
- assert Sync at the beginning of the segment and negate it at a defined point within the segment
To start a sequence on a trigger, place a brief DC waveform of 0 V (or any other desired value) in front of the other waveforms in the sequence, and set the segment to wait for a trigger before advancing. For 33500 Series instruments, the minimum segment length is 8 Sa, and for 33600 Series instruments, the minimum segment length is 32 Sa.

|
If a segment is set up to repeat until a trigger is received, the segment will always finish before continuing to the next segment. In addition, a short segment may repeat for additional cycles in order to clear the sequence sample buffer before continuing. |
Quasi-Gaussian Noise
The Noise waveform is optimized for both quantitative and qualitative statistical properties. It does not repeat for more than 50 years of continuous operation. Unlike a true gaussian distribution, there is zero probability of getting a voltage beyond the instrument’s Vpp setting. The crest factor (peak voltage divided by RMS voltage) is approximately 4.6.
You can vary the Noise bandwidth from 1 mHz to the instrument's maximum bandwidth. The energy in the noise signal is concentrated in a band from DC to the selected bandwidth, so the signal has greater spectral density in the band of interest when the bandwidth setting is lower. In audio work, for example, you might set the bandwidth to 30 kHz, to make the audio band signal strength 30 dB higher than if the bandwidth were set to 30 MHz.
PRBS
A Pseudo-Random Bit Sequence (PRBS) has two levels (high and low), and it switches between them in a manner that is difficult to predict without knowing the sequence generation algorithm. A PRBS is generated by a linear-feedback shift register (LFSR), shown below.

An LFSR is specified by the number of stages it contains and which stages ("taps") feed the exclusive-or (XOR) gates in its feedback network. The PRBS output is taken from the last stage. With properly chosen taps, an L-stage LFSR produces a repetitive PRBS of length 2L-1. The clocking frequency of the LFSR determines the "bit rate" of the PRBS.
The 33500 Series models allow you to set L to 7, 9, 11, 15, 20, or 23, resulting in sequences from 127 to 8,388,607 bits in length.
The 33600 Series models allow you to set L to any whole number value from 3 to 32, resulting in sequences from 7 to 4,294,967,295 bits in length.
The default value for L is 7, resulting in a sequence of 127 bits in length.
Modulation
Amplitude Modulation (AM)
The instrument implements two forms of AM:
- Double-sideband full-carrier (DSB-FC), which has an ITU designation of A3E and is used in AM broadcasting.
The equation for DSB-FC is
y(t)= [(½)+(½)•d•m(t)]•Ac•sin(ωc t)
where
m(t) is the modulating signal
Ac is the carrier amplitude
ωc is the carrier frequency of the carrier
d is the "modulation depth," or fraction of the amplitude range is used by the modulation
For example, a depth setting of 80% varies the amplitude from 10% to 90% of the amplitude setting (90% - 10% = 80%) with either an internal or a full-scale (±5 V on the 33500 Series, ±5 V or ±1 V on the 33600 Series) external modulating signal. You may set depth as high as 120%, as long as you do not exceed the instrument’s maximum output voltage of (±5 V into 50 Ω, ±10 V into high impedance).
The top trace below represents the modulating signal; the bottom trace represents the modulated carrier.

- Double-sideband suppressed-carrier (DSSC). Many modern communications systems employ DSSC on each of two carriers that have the same frequency but a 90-degree phase difference. This is called quadrature amplitude modulation (QAM).
The equation for DSSC is y(t)=d•m(t)•sin(ωc t)
In DSB-SC, the carrier signal is inverted whenever m(t) < 0. For QAM, the second carrier signal would be cos(ωc t), making it 90 degrees out of phase from the first carrier.
Frequency Modulation (FM)
Frequency modulation varies a carrier signal’s frequency according to the modulating signal:
y(t)=Ac•sin[(ωc+d•m(t) )•t]
where m(t) is the modulating signal and d is the frequency deviation. FM is called narrowband if the deviation is less than 1% of the modulating signal’s bandwidth, and wideband otherwise. You can approximate the modulated signal’s bandwidth with the following equations.
BW ≈ 2•(Modulating Signal Bandwidth) for narrowband FM
BW ≈ 2•(Deviation+Modulating Signal Bandwidth) for wideband FM
The top trace below represents the modulating signal; the bottom trace represents the modulated carrier.

Phase Modulation (PM)
PM is similar to FM, but the phase of the carrier waveform is varied, rather than the frequency:
y(t)=sin[ωc t+d•m(t) ]
where m(t) is the modulating signal and d is the phase deviation.
Frequency-Shift Keying (FSK) Modulation
FSK is similar to FM, except the carrier frequency alternates between two preset values, the carrier frequency and the hop frequency. Sometimes the hop and carrier frequencies are called "Mark" and "Space," respectively. The rate at which the switching between these values occurs is determined by an internal timer or the signal on the rear-panel Ext Trig connector. Frequency changes are instantaneous and phase-continuous.
The internal modulating signal is a square wave with 50% duty cycle.
The top trace below represents the modulating signal; the bottom trace represents the modulated carrier.

Binary Phase Shift Keying (BPSK)
BPSK is similar to FSK, except it is the carrier’s phase, rather than its frequency, that switches between two values. The rate at which the switching between these values occurs is determined by an internal timer or the signal on the rear-panel Ext Trig connector. Phase changes are instantaneous.
The internal modulating signal is a square wave with 50% duty cycle.
Pulse Width Modulation (PWM)
PWM is only available for the Pulse waveform, and the pulse width varies according to the modulating signal. The amount by which the pulse width varies is called the width deviation, and it can be specified as a percentage of the waveform period (that is, duty cycle) or in units of time. For example, if you specify a pulse with 20% duty cycle and then enable PWM with a 5% deviation, the duty cycle varies from 15% to 25% under control of the modulating signal.
Additive Modulation (Sum)
The "Sum" feature adds the modulating signal to the carrier. For example, you can add controlled amounts of variable-bandwidth noise to a signal or create two-tone signals. The instrument's internal modulation generator can produce the same continuous waveform as the main generator, so the Sum function lets you to create many signals that would have required two instruments before.
The Sum feature increases the amplitude of the output signal by the amplitude of the modulating signal. This might cause the instrument to switch to a higher output-voltage range, resulting in a momentary signal loss. If this is a problem in your application, turn on the Range Hold function. If the voltage increase could damage your device under test, apply Voltage Limits.
Burst
You can configure the instrument to output a waveform with for a specified number of cycles, called a burst. You can use burst in one of two modes: N-Cycle Burst (also called "triggered burst") or Gated Burst.
An N-Cycle burst consists of a specific number of waveform cycles (1 to 1,000,000) and is always initiated by a trigger event. You can also set the burst count to "Infinite," which results in a continuous waveform once the instrument is triggered.
In the image below, the top trace is the sync output, and the bottom one is the main output.

Three-Cycle Burst Waveform
For bursts, the trigger source can be an external signal, an internal timer, the key, or a command from the remote interface. The input for external trigger signals is the rear-panel Ext Trig connector. This connector is referenced to chassis ground (not floating ground). When not used as an input, the Ext Trig connector can be configured as an output to enable the instrument to trigger other instruments at the same time that its internal trigger occurs.
An N-Cycle burst always begins and ends at the same point in the waveform, called the start phase.
In GATed burst mode, the output waveform is on or off, based on the signal at the rear-panel Ext Trig connector. Select this signal's polarity using BURSt:GATE:POLarity. When the gate signal is true, the instrument outputs a continuous waveform. When the gate signal goes false, the current waveform cycle is completed and the instrument stops and remains at the voltage level corresponding to the waveform's starting burst phase. For a noise waveform, the output stops immediately when the gate signal goes false.
Frequency Sweep
Frequency sweeping is similar to FM, but no modulating waveform is used. Instead, the instrument sets the output frequency based on either a linear or logarithmic function, or a list of up to 128 user-specified frequencies. A linear sweep changes the output frequency by a constant number of Hz per second, and a logarithmic sweep changes the frequency by a constant number of decades per second. Logarithmic sweeps let you cover wide frequency ranges where resolution at low frequencies could be lost with a linear sweep.
Frequency sweeps are characterized by a sweep time (during which the frequency changes smoothly from the start frequency to the stop frequency), a hold time (during which the frequency stays at the stop frequency), and a return time (during which the frequency returns smoothly and linearly to the start frequency). Trigger settings determine when the next sweep begins.

Attributes of AC Signals
The most common AC signal is a sine wave. In fact, any periodic signal can be represented as the sum of different sine waves. The magnitude of a sine wave is usually specified by its peak, peak-to-peak, or root-mean-square (RMS) value. All of these measures assume that the waveform has zero offset voltage.
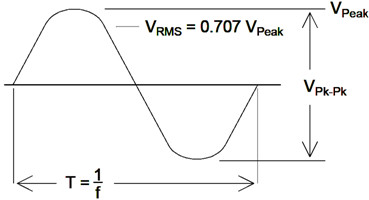
A waveform's peak voltage is the maximum absolute value of all of its points. The peak-to-peak voltage is the difference between the maximum and minimum. The RMS voltage equals the standard deviation of all waveform points; it also represents the one-cycle average power in the signal, minus the power in any DC component of the signal. Crest factor is the ratio of a signal’s peak value to its RMS value and varies according to waveshape. The table below shows several common waveforms with their respective crest factors and RMS values.

If an average-reading voltmeter is used to measure the "DC voltage" of a waveform, the reading may not agree with the DC Offset setting. This is because the waveform may have a non-zero average value that would be added to the DC Offset.
You may occasionally see AC levels specified in "decibels relative to 1 milliwatt" (dBm). Since dBm represents a power level, you need to know the signal’s RMS voltage and the load resistance in order to make the calculation.
dBm = 10 x log10 (P / 0.001) where P = VRMS2 / RL
For a sine wave into a 50 Ω load, the following table relates dBm to voltage.
| +23.98 dBm |
3.54 Vrms |
10.00 Vpp |
| +13.01 dBm |
1.00 Vrms |
2.828 Vpp |
| +10.00 dBm |
707 mVrms |
2.000 Vpp |
| +6.99 dBm |
500 mVrms |
1.414 Vpp |
| 3.98 dBm |
354 mVrms |
1.000 Vpp |
| 0.00 dBm |
224 mVrms |
632 mVpp |
| -6.99 dBm |
100 mVrms |
283 mVpp |
| -10.00 dBm |
70.7 mVrms |
200 mVpp |
| -16.02 dBm |
35.4 mVrms |
100 mVpp |
| -30.00 dBm |
7.07 mVrms |
20.0 mVpp |
| -36.02 dBm |
3.54 mVrms |
10.0 mVpp |
| -50.00 dBm |
0.707 mVrms |
2.00 mVpp |
| -56.02 dBm |
0.354 mVrms |
1.00 mVpp |
For 75 Ω or 600 Ω loads, use the following conversions:
dBm (75 Ω) = dBm (50 Ω) – 1.76
dBm (600 Ω) = dBm (50 Ω) – 10.79
Signal Imperfections
For sine waves, common signal imperfections are easiest to describe and observe in the frequency domain, using a spectrum analyzer. Any output signal component with a frequency different from the fundamental (or "carrier") is considered to be distortion. Those imperfections can be categorized as harmonic distortion, non-harmonic spurious, or phase noise, and they are specified in decibels relative to the carrier level, or "dBc."
Harmonic Distortion
Harmonic components occur at integer multiples of the fundamental frequency and are usually created by non-linear components in the signal path. At low signal amplitudes, another possible source of harmonic distortion is the Sync signal, which is a square wave with many strong harmonic components that can couple into the main signal. Although Sync is highly isolated from the instrument's main signal outputs, coupling can occur in external cabling. For best results, use high-quality coaxial cables with double or triple shields. If Sync is not required, leave it unconnected or off.
Non-Harmonic Spurious
One source of non-harmonic spurious components (called "spurs") is the digital-to-analog converter (DAC) that converts the digital waveform values into voltage. Non-linearity in this DAC gives rise to harmonics that can be higher than the Nyquist frequency and will therefore be aliased to a lower frequency. For example, the fifth harmonic of 30 MHz (150 MHz) could create a spur at 100 MHz.
Another source of non-harmonic spurs is the coupling of unrelated signal sources (such as the embedded controller’s clocks) into the output signal. These spurs usually have constant amplitude and are most troublesome at signal amplitudes below 100 mVpp. For optimal signal purity at low amplitudes, keep the instrument’s output level relatively high and use an external attenuator.
Phase Noise
Phase noise results from small, instantaneous changes in the output frequency ("jitter"). On a spectrum analyzer, it appears as a rise in the apparent noise floor near the frequency of the output signal. The phase noise specification represents the amplitudes of the noise in 1 Hz bands located 1 kHz, 10 kHz, and 100 kHz away from a 30-MHz sine wave. Be aware that spectrum analyzers also have phase noise, so the levels you read may include analyzer phase noise.
Quantization Noise
Finite resolution in the waveform DAC causes voltage quantization errors. Assuming the errors are uniformly distributed over a range of ±0.5 least-significant bit, the equivalent noise level for standard waveforms is approximately -95 dBc. At this level, other sources of noise in the instrument dominate. Quantization noise can be of concern, though, in arbitrary waveforms that do not use the whole range of DAC codes (-32767 to +32767). Scale arbitrary waveforms to use the entire range, if possible.
Ground Loops
The signal-generation portion of the instrument is isolated from chassis (earth) ground. This helps eliminate ground loops in your system and also allows you to reference the output signal to voltages other than ground. The illustration below shows the instrument connected to a load through a coaxial cable. Any difference in ground potentials (VGND) will tend to drive current IGND through the shield of the cable, thus causing a voltage drop due to the shield’s impedance (ZSHIELD). This voltage (IGND x ZSHIELD) appears as an error in the load voltage. However, since the instrument is isolated, there is a high series impedance (typically >1 MΩ) in parallel with 50 nF) to oppose the flow of IGND and thereby minimize this effect.

At frequencies above a few kHz, a coaxial cable’s shield becomes inductive, rather than resistive, and the cable begins to act like a transformer. When this happens, voltage drops in the shield due to IGND tend to be offset by equal voltages in the center conductor, thereby reducing the effects of ground loops at higher frequencies. Coaxial cables with two or three braided shields are much better than those with single- braided or foil shields because they have lower resistance and therefore become transformers at lower frequencies.
To reduce errors due to ground loops, connect the instrument to the load using a high-quality coaxial cable and ground it at the load through the cable’s shield. If possible, make sure the instrument and the load are connected to the same electrical outlet to minimize further differences in ground potential.
Be aware that the outer shells of the Sync and Modulation In connectors are connected to those of the main output connector(s). Cables attached to Sync and/or Modulation In are therefore potential sources of ground loops. Also be aware that attempting to drive those connector shells to different voltages can cause high current to flow through the instrument, possibly causing damage.