Crest Factor Reduction (CFR) Concept
CFR is a technique used to reduce the PAPR (Peak To Average Power Ratio) of the transmitted signals so that the power amplifier can operate more efficiently. In practice, there are different CFR algorithms. In this section, the two algorithms used in N7614C Signal Studio for Power Amplifier Test 2022 are introduced.
Clipping and Filtering
Clipping and filtering is the conventional method, including hard clipping and low-pass filtering.

As shown in the above figure, clipping can cause sharp corners in a clipped signal, which leads to an unwanted out-of-band emission(increased ACP).
The clipping mathematical equation is as follows:

x(n) is the input signal, c(n) is the clipping algorithm here.
To reduce the unwanted out-of-band emissions, the clipped signal will then go through a low-pass filter to reduce the high frequency signals which correspond to the sharp corners in the clipped signal.
So for clipping and filtering method, the main parameters are target PAPR and the low-pass filter parameters: maximum order, pass frequency, stop frequency, pass ripple and stop ripple.
Peak Windowing
Peak windowing aims to smooth the sharp corners from hard clipping. In peak windowing algorithm, the clipping is implemented by multiplying the original signal in the region of the peak with a windowing function as shown in the following figure.
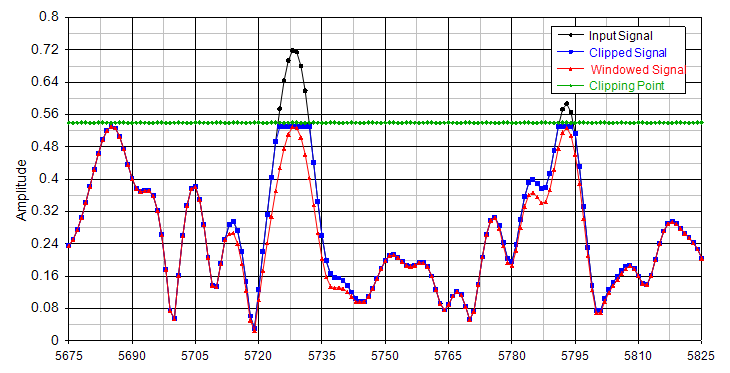
The idea of the windowing method is to filter it with a windowing function w(n) to give a smooth version of the clipping signal, that is,

where w(n) is a common window function, such as Kaiser, Gaussian and Hamming, and p(n) is a weighting coefficient.
Peak Cancellation
Peak cancellation is an algorithm to reduce the PAPR of a signal. It aims to strike a balance between the out-of-band emission and in-band waveform quality when compressing the signal to a target PAPR.
First, it identifies the peaks that are above a threshold which is determined by the target PAPR. As illustrated in the figure below, the red line is the portion of signal with amplitude greater than the threshold. The magnitude of each pulse is identified, and gives rise to a sequence of peaks as shown as the yellow line.

Next, the resultant peaks are divided into segments, and in each segment only the peak with the maximum magnitude among all peaks in this segment will survive. Let’s say the signal length is L and segment length is N, then after this processing, there will be [L/N]+1 peaks.
Then, apply a low-pass filter on the peaks to generate cancellation pulses. The pulse shape depends on the time response of the low-pass filter. For a single pulse, it looks like this.

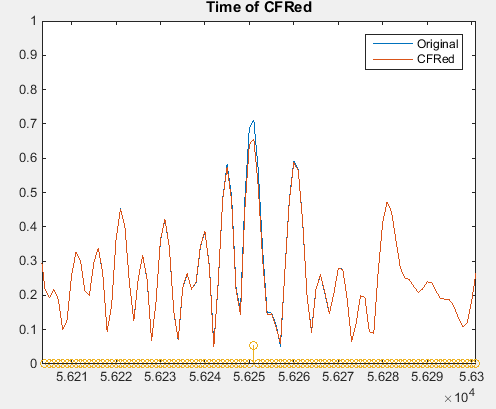
Finally, the PAPR reduced output signal is calculated by subtracting a weighted version of the cancellation pulses from the original input signal. Below figure demonstrates a stretch of signal before CFR and after CFR. The weight can be specified as a percentage.
The target PAPR can’t be achieved by one iteration, therefore, multiple iterations will be performed.