These terms used by FFT Analyzers that may be new to you:
The best way to understand these terms is with a block diagram.
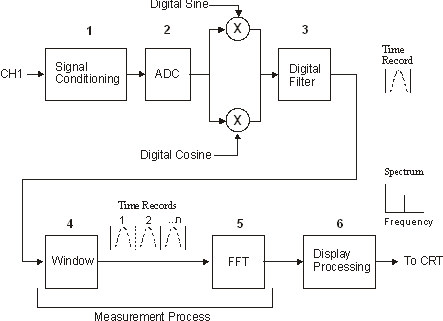
This is a generic block diagram for an FFT (Fast Fourier Transform) analyzer. It is not a complete block diagram of the 89600 VSA software.
Basically, the input signal is first conditioned for optimum performance, and then converted by the ADC (Analog-to-Digital Converter) from analog to digital data (blocks 1 and 2). This digital data is frequently referred to as samples. It is also often called by any of these names:
The samples are then mixed with the analyzer's LO (local oscillator) if necessary. The LO is used to achieve start frequencies greater than 0 Hertz. In this analyzer, you can also enable the LO when the start frequency is 0 Hz by selecting time data zoom.
Next, the samples are filtered by a digital filter to achieve the selected span. The samples coming out of the digital filter are stored in RAM as one or more time records. A is simply a collection of samples and is a digital representation of the input signal.
Usually, the FFT (Fast Fourier Transform) operates on an entire ; and an entire time record is needed before the FFT can compute the spectrum information. This analyzer can, with some configurations, operate on a partial time record- this happens for very narrow spans immediately after a start or continue while in real time (in this case, the analyzer displays "FILLING TIME RECORD" instead of "REAL-TIME MEASUREMENT").
The length of a time record is in seconds. In this analyzer, the time-record length is computed as follows:
| ENBW | |
| Time-record length = | ------------------- |
| RBW |
A time record consisting of many time-domain samples goes into the FFT; frequency-domain samples come out of the FFT. These frequency-domain samples are often referred to as .
The measurement points are then processed as necessary before plotting them on the analyzer's display to create a trace.
Each trace is divided along its x axis into a fixed number of evenly-spaced points. For frequency-domain data, these points are called and determine the frequency resolution of the analyzer's display. Frequency points are also sometimes referred to as , , or .
The frequency points parameter determines the number of "frequency points" in the spectrum traces.
Frequency points, display points, and lines refer to the actual point that is plotted on the display. Bins refers to the region between display points.
The greater the number of frequency points, the greater the resolution. The lower the number of frequency points, the poorer the resolution.
The picture below is shows the relationship between frequency points and bins (bins 0 through 9 are shown).
Each frequency point has a nominal value. This is the value used for the marker's x-axis readout. The nominal value of the first frequency point is the start frequency. The nominal value of the last frequency point is the stop frequency.

For Vector Analyzer measurements, the output of the FFT yields as many measurement points as there are frequency points, and each bin contains one measurement point.
The width of a bin is related to the current frequency span:
![]()
For FFT measurements, a bin represents all frequencies between (NF - 1/2 PBW) and (NF + 1/2 PBW), where NF is the nominal frequency and PBW is the bin bandwidth.
|
Copyright © 2000-2023 Keysight Technologies, Inc. |
|
