How to Debug Scripting Tool Files
Last Updated: 2011-06-23
This topic discusses the following:
Compatible debugging tools for the Interactive Functional Test software
The Interactive Functional Test software's scripting tool allows you to choose a debugging tool to use to troubleshoot scripts. If you choose to use a debugging tool, the debugging tool that you use must be compatible with a Visual Basic .NET 2005 programming environment, which is the programming environment used by the scripting tool. Currently, there are two Visual Basic .NET 2005 compatible debugging tools;
Compatible Visual Basic .NET 2005 debugging tools
-
Microsoft Visual Studio 2005 (Standard, Professional, or Enterprise) (available for purchase)
Note: Microsoft Visual Studio 2005 Express does not include a debugging tool.
-
.NET Framework 2.0 Software Development Kit (SDK) (x86) (free download from Microsoft's download website)
Note: During installation, the .NET Framework 2.0 Software Development Kit wizard provides several installation options. The minimum installation options that are required to work correctly as a debugging tool for the Interactive Functional Test software is the "Tools and Debugger" option.
To open a script in debug mode
-
Click the Run with debugger icon ( ). Note: The Run with debugger icon is grayed out if there are no compatible debuggers to choose from when the Interactive Functional Test software is started. To use a debugger, you must first install one of the tools listed above. (See Compatible Visual Basic .NET 2005 debugging tools)
If you wish to run the script without using a debugger, click the Run button (see How to use the Scripting Tool).
-
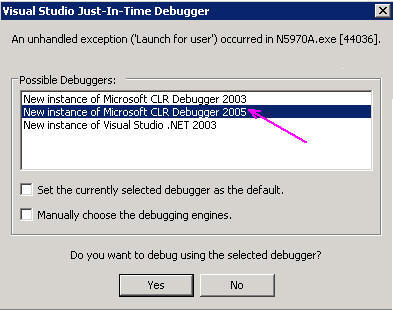
If a debugging tool is not already open, you will be prompted to select a debugger. Choose a Microsoft CLR Debugger 2005. The Interactive Functional Test software will then use the selected debugger (if compatible) to open the currently selected script file in debug mode.
-
If a debugger is already open, the Interactive Functional Test software will then use the debugger (if compatible) to open the currently selected script file in debug mode.
-
Read the Operation Considerations for tips on how to expect the debugger to behave.
How to use the debugger
This topic provides instructions for:
How to insert and remove a breakpoint
When the script execution reaches a breakpoint, the debugger pauses to allow you to inspect the state of your script.
-
To insert a breakpoint click in the gray area in the left margin of the command statement that you want to be the last statement that is executed before pausing (breaking).
-
Right click on an existing breakpoint to set properties, disable, or delete the breakpoint.
How to run to a breakpoint
To run to the next breakpoint, click the Continue icon ( ). This will continue from the next statement that is to be executed, to the next breakpoint in the script.
How to step through a script (Step Into, Step Over, and Step Out)
Once you pause the script execution, you have the ability to step through your script (that is, execute one statement at a time). The figure below shows the icons for stepping into, over, and out of subroutines.
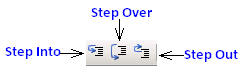
If you are currently in break mode on a line of code that contains a method call, the Step Into command will enter the method and break again on the first line of code inside the method. In contrast, the Step Over command will execute the entire method call and break on the next line of code in the current method. Therefore, you should use Step Into if you want to see what happens inside a method call, and use Step Over if you only want to execute the entire method and continue in the current code block.
The debug menu also contains a Step Out command, which you can use when you want to execute the rest of the current method and return to the calling method. Step Out will break execution at the return point in the calling function.
Closing the Debugger
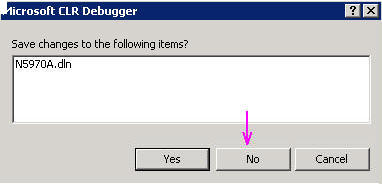
When you close the debugger, you will be prompted if you want to save the N5971.dln item. Select No.
Operating Considerations
Keep in mind the following considerations while using a debugging tool to troubleshoot your script files:
-
Once the script file is opened in debug mode (see How to open a script in debug mode), you can then do typical debugging operations such as inserting breakpoints, step through code, and watching variables.
-
You cannot make changes to a script within the debugging tool.
-
When you open the script file in debugging mode, the debugger automatically names the debug file. There is no way to manually name this file.
-
Each time you click the Run with debugger icon, all the breakpoints that you have set are removed.
-
When the debugger reaches the end of the script, the Continue icon is grayed out. To run the script again in debug mode, you must click the Run with debugger icon from the scripting tool screen.
-
The first time the debugger is launched when Run with debugger is clicked, the script will break at System.Diagnositcs.Debugger.Launch. All subsequent times that Run with debugger is clicked (while the debugger is launched), the first break is a System.Diagnostics.Debugger.Break. The is illustrated in the figure below.
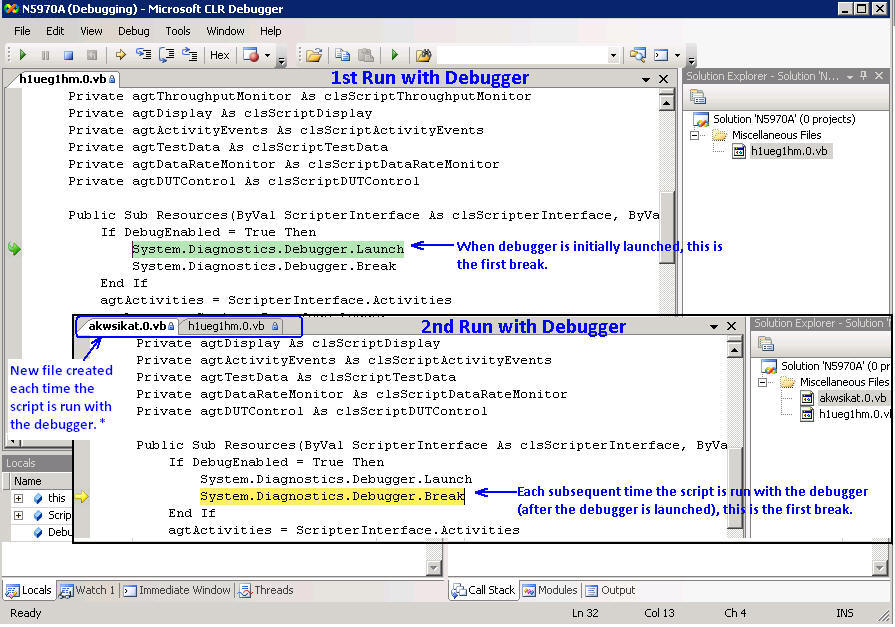
*It is recommended that you set your debugger to reuse the document window rather than opening a new window each time. To do this, click Tools>>Options...>>Environment>>Documents and then select "Reuse current document window, if saved".
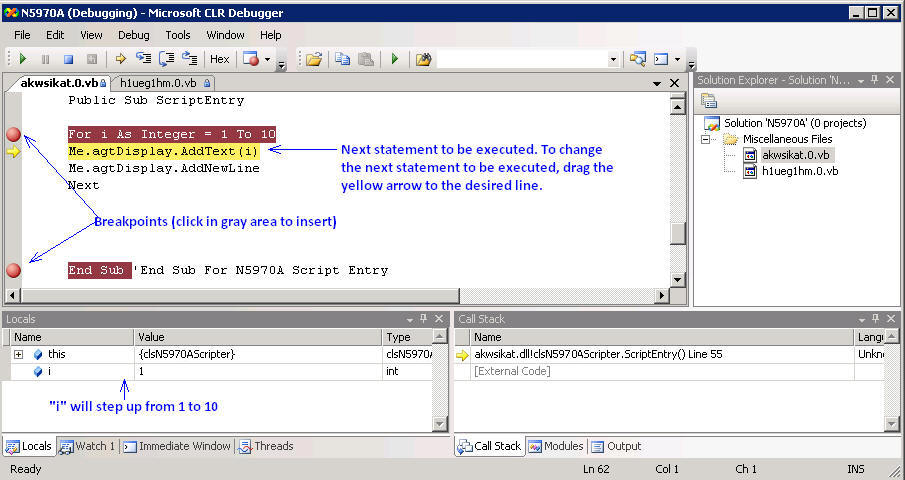
Debugging Example
The figure below is an example of a script file that has been opened in debug mode. The red circles show the breakpoints that have been inserted. The green arrow, or continue icon, (under the File menu item), was clicked to execute the script statements up to the first breakpoint. The yellow arrow indicates the next statement that will be executed if continue is clicked again. This arrow can be moved to different locations within the script. You can also see what the local variables are currently set to and set up any other variables to be watched.

For more information on using the debugger, refer to its associated help files and forums.